Metrics
Capture measurements, progress photos, and performance over time.
Metrics Overview
Track any measurable data point for your clients: body weight, body fat, circumference measurements, or fully custom metrics. HubFit stores every log with a date and value, charts progress over time, and syncs metric answers from check-in forms automatically. Metric management has two layers:
- Metric Library: A workspace-level list of metric definitions (name + unit) that you can reuse across clients.
- Client Metrics: The actual metric instances assigned to a specific client, each with its own history of logged data points.
From the coach dashboard you can:
- Create a metric library of standard and custom metrics
- Assign metrics to individual clients
- Import metrics from the HubFit Library of common templates
- Log data on behalf of a client
- View progress charts, data tables, and weekly averages
- Edit or delete individual data points
- Switch between a per-metric detail view and a weekly overview grid
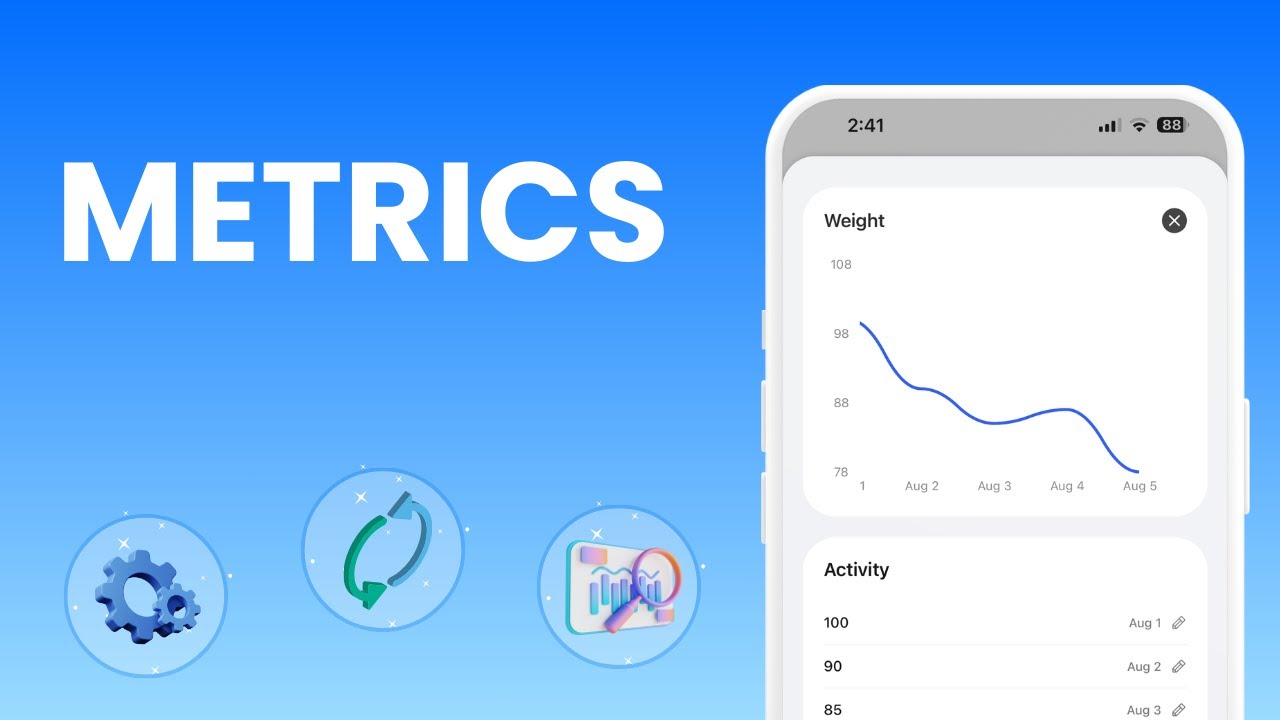
When you open a client's profile, the Metrics tab shows all metrics assigned to that client, each with its historical data, a line chart, and a data table.
Understanding Metric Types
HubFit supports fully custom metrics — you define the name and unit. To speed things up, the platform ships with a built-in HubFit Library of common templates covering body composition (weight, body fat, BMI, muscle mass, etc.) and body measurements (waist, hip, shoulders, arms, legs, etc.). Default units match your workspace unit settings (metric or imperial).
You are not limited to the built-in templates. Create any metric with any unit — examples:
| Custom Metric | Unit |
|---|---|
| Resting Heart Rate | bpm |
| Sleep Duration | hours |
| Water Intake | L |
| Bench Press 1RM | kg |
| Vertical Jump | cm |
| Sprint Time | seconds |
| Daily Steps | steps |
| VO2 Max | mL/kg/min |
Creating Your Metric Library
Your Metric Library is a workspace-level collection of metric definitions. Metrics you add here can later be imported to individual clients with a single click.
Adding a metric from scratch
Adding a metric from the HubFit Library
Editing a metric
Deleting a metric
Assigning Metrics to a Client
Once you have metrics in your library, you can assign them to individual clients. You can also create one-off metrics directly on a client's profile.
Importing from your Metric Library
Creating a new metric directly on a client
You can also use the HubFit Library tab to pick from the built-in templates, just as you would in the workspace library.
Logging Metric Data for a Client
Both coaches and clients can log metric data. As a coach, you can log data on behalf of any client.
The new data point appears in the chart and data table immediately.
Editing a data point
Deleting a data point
Reading the Progress Chart
When you select a metric on a client's profile, the right panel shows a line chart and a data table.
Line chart
The chart plots logged values over time as a smooth line. Use the date range dropdown to zoom in on recent data or view the full history.
Average and trend indicator
Above the chart, HubFit displays:
- Average: The mean value across the selected date range, with the unit label.
- Trend indicator: A percentage showing how the second half of the range compares to the first half. A green arrow-up means the value increased; a red arrow-down means it decreased; a grey dash means no change.
Data table
Below the chart is a table listing every data point in the selected range, sorted newest first. Each row shows the value and date. Click the edit icon on any row to update or delete the entry.
Weekly Overview
The Metrics tab offers two views, toggled with the Metrics / Overview switch at the top:
Metrics view
The default. Shows the metric list on the left and the chart + data table on the right for the selected metric.
Overview view
A weekly grid that shows all metrics at once. Each row is a metric; columns are Monday through Sunday plus a weekly average.
Use the week picker arrows to navigate between weeks. The average column calculates the mean of all non-zero values logged that week.
Editing or Removing a Client's Metric
Editing the metric definition
Deleting a metric from a client
Metrics and Check-In Forms
Check-in forms can include Metric question types. When a client submits a check-in form that contains metric questions, the answers are automatically synced to the client's metric data.
How it works
- When you add a question of type Metric to a check-in form, you set a metric name and unit (e.g. "Weight", "kg").
- When the client submits the form, their answer is automatically logged as a metric data point on their profile.
This means you do not need to manually create every metric in advance. Standard check-in templates (Daily, Weekly, Bi-Weekly, Monthly) already include metric questions for common data points like body weight, steps, and waist measurements.
For more on building check-in forms, see the Forms article.
Zapier Integration
Metric submissions trigger the Client Added Metric Zapier event. This means you can automate workflows when a client logs a new data point, for example, sending a Slack notification, updating a Google Sheet, or triggering an email.
The Zapier payload includes: client ID, client name, client email, metric name, date, and the logged value with unit.
Logging Metrics in the App
Clients can log metrics from the mobile app by tapping the + button on their Metrics tab, selecting a metric, entering the value, and choosing a date — including past dates for backdating. Clients can also edit or delete their own entries.
If you have set up check-in forms with metric questions, client answers are automatically logged as metric data points — no extra action needed from the client.
Frequently Asked Questions
Can clients log their own metrics? Yes. Clients can log metrics from the app by tapping the + button on their Metrics tab. They can also backdate entries by selecting a past date. You receive a notification when a client logs a value.
Do check-in form answers sync to metrics? Yes. If your check-in form includes a Metric question type, the client's answer is automatically logged as a metric data point when they submit the form.
Why is a metric showing on a client's profile that I did not create? Check-in forms with metric questions automatically create the metric on the client's profile if it does not already exist. This is expected behaviour.
Can I track metrics through Zapier? Yes. When a client logs a metric, it triggers the Client Added Metric Zapier event. You can use this to automate workflows like updating a Google Sheet or sending a notification.
How do I switch my metrics library from metric to imperial units? Go to Settings > Profile and change your unit preference. This updates the default units for new metrics. However, existing metrics in your library and custom metrics already assigned to clients keep their existing units and will need to be updated manually.
Did this answer your question?